LandTrack Systems used LandTracker to download all WA Department of Mines Industry Regulation and Safety’s (‘DMIRS’) tenement data that includes expenditure data all the way back to 2010 and we compared this to Australian Bureau of Statistic’s (‘ABS’) exploration statistics released in March 2018. Some interesting observations appeared.
The DMIRS WA statistics appear to support the ABS statistics that there has been a bottom out in the market and we are on an upswing.
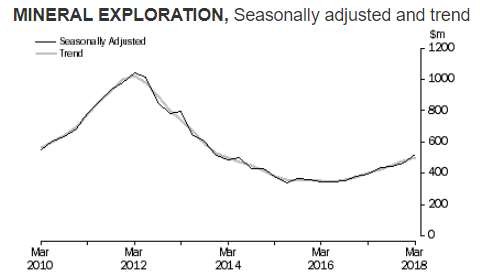
The ABS stats show a $600 million drop in exploration expenditure Australia wide from 2012 to 2015. DMIRS stats show a drop in exploration expenditure on exploration licences and prospecting licences of approximately $1.49b (remembering that expenditure reports are lodged progressively through out the year).
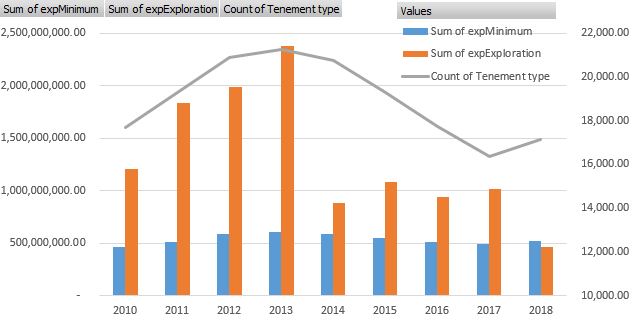
The first graph of DMIRS data is shown above and is total exploration expenditure against total Statutory Commitments on Exploration Licences (‘E’) and Prospecting Licence (‘P’) from 2010 to 2018 years, including a line graph of the number of tenements.
A few of things to note;
- The DMIRs expenditure data has a 12 month lag to the ABS data. See the 2nd graph below where the ABS data is overlaid on the DMIRS data.
- The expenditure for 2018 is only a for 5 months so the projected expenditure would be the same as previous years 4 years.
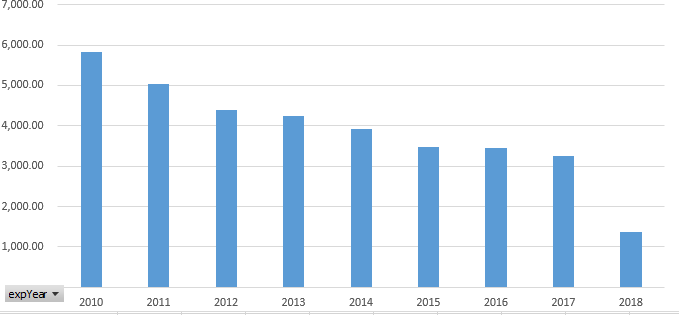
- The number of Es and Ps decrease from a peak of 21,265 in 2013 to a low of 16,347 in 2017 (a decrease of 4548 tenements) and has increased to 17,126 to 2018.
- The DIMRS data supports the ABS data in broad trends and the number of tenements reflects in the increase in expenditure of exploration, though appears to lag by 12 months.
- The total expenditure has always been in excess of the total commitment even in middle of the slump.
- The Exploration expenditure increase in the last 12 months is very gradual.
The next graph is the number of Exemptions from Expenditure lodged during each year on exploration and prospecting licences.
This raises a number of conundrums:
-
- We see expenditure drop dramatically from 2013 to 2014 but there is only a 7% drop in exemptions. One would have thought if there is less expenditure there would be more exemptions.
- Maybe the expenditure is more targeted so commitment is met?
- Maybe 530 less tenements from 2013 to 2014 were the cause of the 326 exemptions?
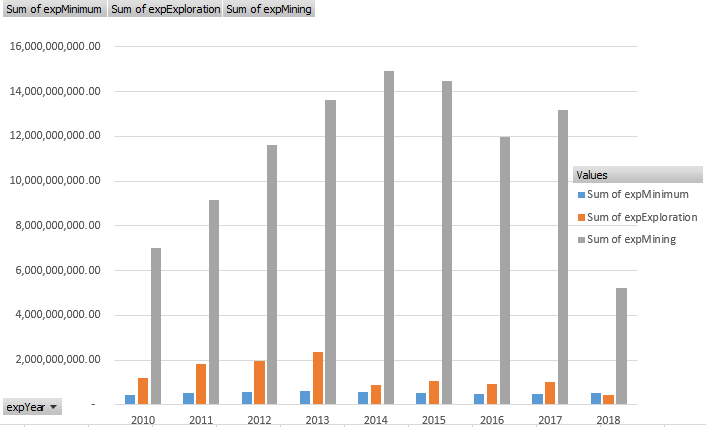
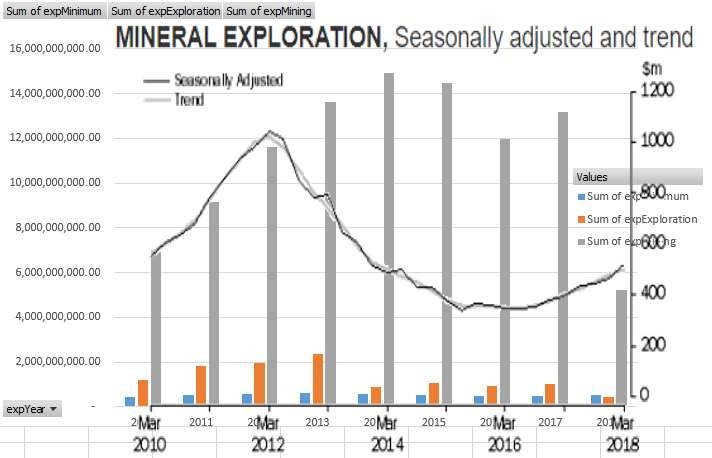
The chart below is a comparison of exploration expenditure and statutory commitments of Es and Ps against mining expenditure.
We have overlaid the ABS exploration graph over the table below (but has a different expenditure scale).
A couple of observations from graphs:
-
-
- The 2018 data is not for a full year.
- Exploration expenditure in miniscule compared to mining expenditure.
- Remember that DMIRS data lags ABS data by 12 months, mining expenduture didn’t drop off for at least 2 years after exploration expenditure.
- It dropped $2b from 2015 to 2016 and increased $1b in 2017.
-
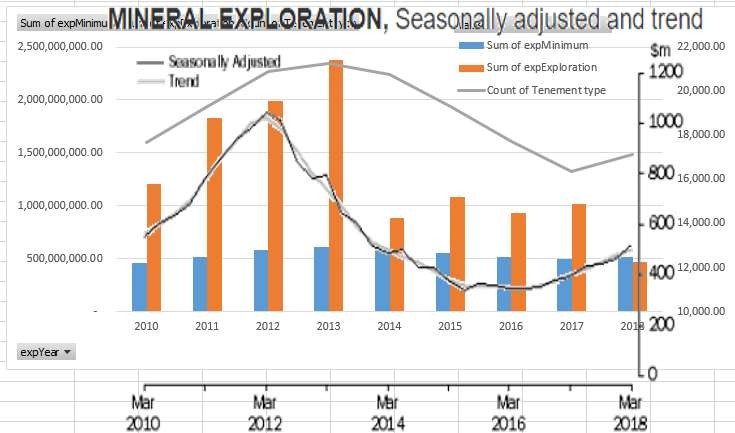
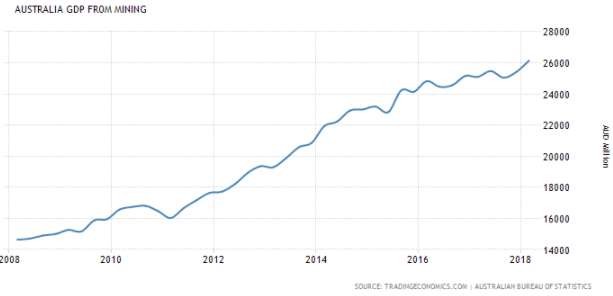
Below from the ABS is a graph for the contribution of ‘GDP from Mining’ again we see a blip down in 2015 and continuing increase. Reflecting the $2b drop in mining in 2016 in the above graph (remembering the 12 month lag in the DMIRS data)
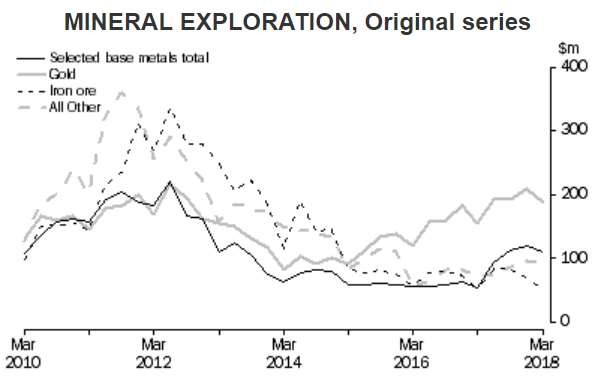
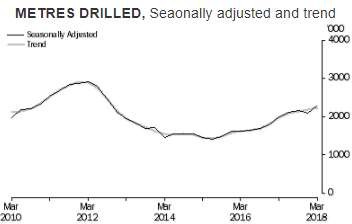
Below are ABS graphs until March 2018 (8412.0 – Mineral and Petroleum Exploration, Australia, Mar 2018)